
At its core, calculating your restaurant’s prime cost is simple: you combine your total Cost of Goods Sold (COGS) with your total labor costs. Don’t let the simple math fool you. This single number is the most important metric for understanding your restaurant’s financial health and represents the biggest chunk of your controllable expenses.
Understanding Your Restaurant’s Most Important Metric
Prime cost is the real-time financial pulse of your restaurant. It tells you exactly how much you’re spending on products and people to generate every dollar of sales. Mastering this isn’t just an accounting exercise; it’s about making smarter operational decisions that directly pump up your profitability.
Think of it this way: everything from the market price of avocados to your line cook’s overtime hours flows directly into this one figure. When you know how to calculate it and, more importantly, read it, you can spot problems before they spiral out of control. It’s the difference between reacting to a bad P&L at the end of the month and proactively managing your business for consistent success.
Why Prime Cost Matters So Much
Ignoring your prime cost is like trying to drive across the country without a fuel gauge. You might feel like you’re making good time, but you have no idea if you’re about to run out of gas. Keeping a close eye on this metric gives you a massive advantage.
- Informed Menu Pricing: It helps you engineer your menu and price your dishes to guarantee profitability on every plate that leaves the kitchen.
- Smarter Staffing: It allows you to build efficient schedules that align with sales forecasts, preventing the profit-killing mistake of overstaffing on a slow Tuesday.
- Tighter Cost Control: It shines a spotlight on inefficiencies in your kitchen and bar operations, from food waste, and spoilage, to sloppy portion control.
A healthy prime cost is the foundation of a sustainable restaurant. Tracking it gives you the hard data you need to protect your razor-thin profit margins.
The industry benchmark of keeping prime cost at or below 60% is a vital target. For a deeper look at industry benchmarks, you can check out our guide on essential industry ratios for restaurants. For an even more thorough breakdown of this crucial metric, you can explore a complete guide to your restaurant prime cost. The core lesson has always been the same: operators who master their prime cost have a serious competitive edge.
Calculating Your True Cost of Goods Sold
Before you can nail down your prime cost, you have to get a handle on its biggest component: the Cost of Goods Sold (COGS). This number is the direct cost of every single ingredient, food, and beverage that your restaurant used to ring up sales over a specific period. It’s so much more than just the total on your supplier invoices.
Getting this figure right depends entirely on diligent, consistent inventory tracking. There’s no way around it. A sloppy count leads to a bogus COGS number, which throws your whole prime cost calculation out of whack and, worse, hides critical problems in your operation.
The Core COGS Formula
At its heart, the calculation is pretty simple. You’re just measuring the value of the inventory you actually used within a set timeframe, whether that’s a week or a month.
The formula is a straightforward, three-part equation:
Beginning Inventory + Purchases – Ending Inventory = COGS
Let’s quickly break down what each piece of that puzzle means for your restaurant:
- Beginning Inventory: The total dollar value of all food and beverage products sitting on your shelves at the very start of the period.
- Purchases: The total cost of all the food and drinks you bought from suppliers during that same period.
- Ending Inventory: The total dollar value of all inventory you have left on hand when the period ends.
The number you get tells you exactly how much your ingredients cost to produce the sales you made.
COGS Calculation in Action: A Pizzeria Example
Let’s put this formula to work in a real-world scenario. Imagine you run a neighborhood pizzeria and need to calculate your COGS for the month of April.
First, you do a full inventory count on April 1. You find you have $15,000 worth of cheese, flour, tomatoes, pepperoni, and beverages in stock. That’s your Beginning Inventory.
Throughout April, your invoices show you purchased an additional $8,000 in ingredients and drinks. That’s your Purchases.
On April 30, you take inventory again and find you have $12,000 worth of stock left. This is your Ending Inventory.
Now, let’s plug those numbers into the formula:
$15,000 (Beginning Inventory) + $8,000 (Purchases) – $12,000 (Ending Inventory) = $11,000 (COGS)
Boom. Your pizzeria’s Cost of Goods Sold for April was $11,000. This number is the first, crucial half of your prime cost equation. Knowing your COGS is also essential for figuring out your restaurant’s overall food cost percentage, a key metric for pricing your menu profitably. You can learn more about how to calculate your food cost percentage in our detailed guide.
Common Pitfalls That Skew Your COGS
Even a simple formula can go wrong if you’re not paying attention. A few common variables can easily distort your COGS calculation, making it look higher or lower than reality. It’s critical to account for them.
Make sure you track and subtract the value of these items from your final COGS figure to get a true number:
- Employee Meals: The cost of food for your staff is a labor-related benefit, not a direct cost of sales. It belongs in a different bucket.
- Promotional or Comped Items: If you give away a free appetizer to a regular or a dessert to fix a mistake, the cost of those ingredients is a marketing or guest relations expense.
- Waste and Spoilage: You absolutely have to track spoiled or wasted product. While it’s a loss, lumping it into your COGS can mask major inefficiencies in your kitchen’s ordering and prep systems.
By carefully accounting for these factors, you ensure your COGS figure is a true reflection of what you spent to create what you actually sold. This kind of precision is the bedrock of a prime cost calculation you can trust.
Calculating Your Total Labor Cost
Once you have a handle on your Cost of Goods Sold, the other half of the prime cost equation is your total labor cost. Getting this number right is obviously critical, but it’s also where many operators make a simple but costly mistake. They stop at gross wages and salaries, missing a huge chunk of what they actually spend on their team.
Your real labor cost is a much bigger number. It has to include all the “hidden” expenses that add up fast, like payroll taxes, workers’ comp, health insurance, and paid time off. If you ignore these costs, you’re flying blind with a dangerously inaccurate picture of your restaurant’s health. You’ll always understate your prime cost.
Uncovering All Your Labor Expenses
To get your total labor cost right, you need to look past the weekly schedule. The real number is every single dollar you spend to employ your staff. Your payroll reports are the best place to find this information.
Here’s a quick rundown of what you need to pull together for a specific period, whether it’s a two-week pay cycle or a full month:
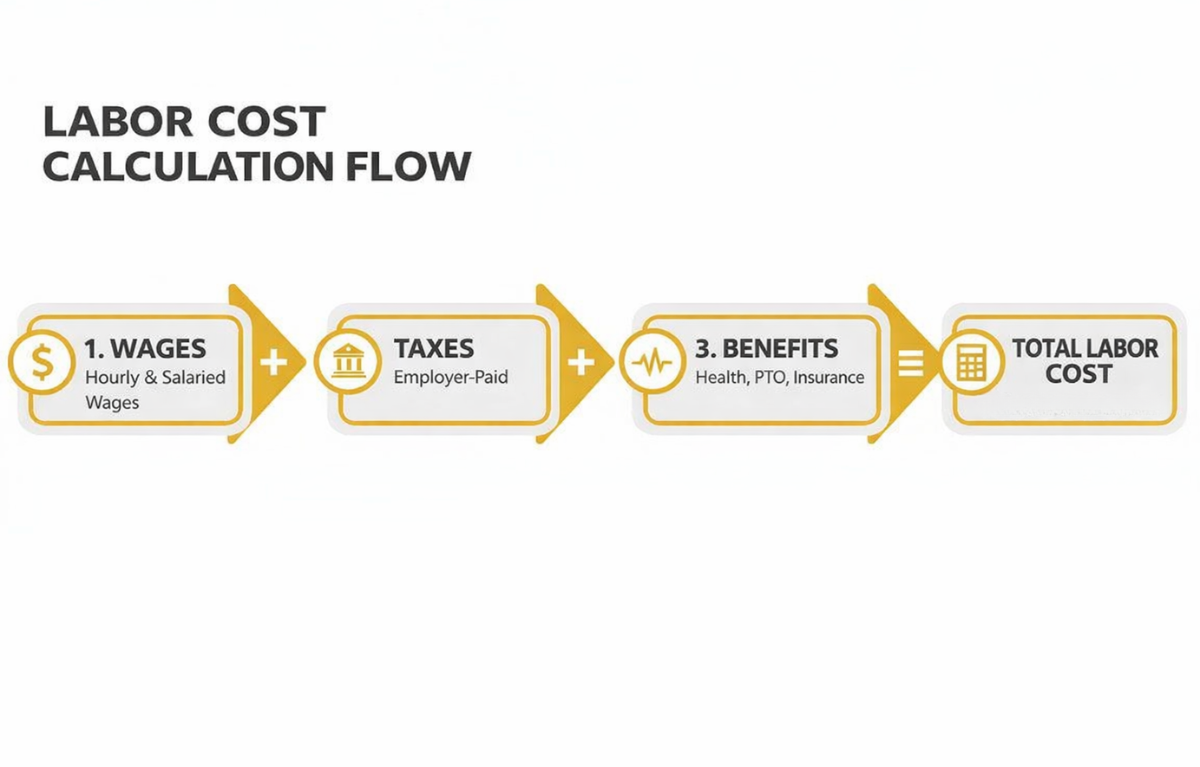
- Gross Wages and Salaries: This is the easy part—the total amount you paid all your hourly and salaried employees before any deductions.
- Payroll Taxes: This is your share of FICA (Social Security and Medicare), plus federal and state unemployment taxes (FUTA and SUTA).
- Workers’ Compensation: The insurance premium you pay to cover potential on-the-job injuries is a direct labor expense.
- Employee Benefits: Tally up what you contribute toward health insurance plans, dental, retirement accounts, or any other benefits you offer.
- Paid Time Off (PTO): Add up the value of any paid vacation, sick days, or personal days your team used during that period.
- Bonuses and Overtime: Don’t forget to include any performance bonuses, overtime pay, or other cash incentives.
The real cost of an employee isn’t just their hourly rate; it’s the fully loaded cost that includes taxes, insurance, and benefits. Forgetting these additional expenses can understate your true labor cost by 20% to 30% or even more.
A Practical Example of Calculating Total Labor
Let’s walk through a real-world scenario for a casual dining spot calculating labor for the month of May. The manager pulls data from payroll and benefits reports to get the following numbers:
| Labor Cost Component | Amount for May |
|---|---|
| Gross Hourly Wages | $18,500 |
| Manager & Chef Salaries | $12,000 |
| Overtime Pay | $1,200 |
| Employer Payroll Taxes (FICA, FUTA, SUTA) | $3,500 |
| Workers’ Compensation Insurance Premium | $850 |
| Health Insurance Contributions | $2,500 |
| Paid Time Off (Used in May) | $900 |
To find the total labor cost, you just add it all up:
$18,500 + $12,000 + $1,200 + $3,500 + $850 + $2,500 + $900 = $39,450
The restaurant’s total labor cost for May is $39,450. This is the number you need. Using just the $30,500 in base wages would give you a completely misleading prime cost.
Using Technology to Your Advantage
Let’s be honest, hunting down all this data from different reports can be a huge time-suck and it’s easy to make mistakes. This is where modern payroll and POS systems are a game-changer. Integrating them lets you automate most of the heavy lifting.
Your payroll software can spit out reports that automatically summarize gross wages, employer tax contributions, and benefits costs for any period you choose. When you pair that with sales data from your POS, you can quickly see how your labor spending is tracking against revenue.
For a deeper look at this, check out our guide on how to calculate labor cost percentage to see how these two metrics work together. This kind of automation doesn’t just save you hours of admin work; it gives you the accurate, reliable data you need to manage your business. With this true total labor cost in hand, you’re ready to put it together with your COGS and find your restaurant’s prime cost.
Let’s Put It All Together with a Real-World Example
Alright, we’ve covered the nuts and bolts of finding your true Cost of Goods Sold and total labor cost. Now it’s time to connect the dots. Seeing the full prime cost calculation in action makes the whole process click and shows you why this metric is such a powerhouse for operators.
We’ll walk through a hypothetical casual dining spot, “The Corner Table,” for a single month to see how the numbers flow from start to finish. This isn’t just about the math; it’s about what you do with that final number once you have it.
Setting the Scene at The Corner Table
Let’s say The Corner Table has just closed out its books for July. After pulling the necessary reports, the manager now has the key numbers needed to calculate prime cost.
First, COGS. After completing a full inventory count and accounting for all purchases, the restaurant’s Cost of Goods Sold for July came to $30,000.
Next, payroll. The Corner Table’s total labor cost for the month was $35,000.
With these two figures, calculating prime cost in dollars is straightforward:
Total Prime Cost = Total COGS + Total Labor Cost
$30,000 + $35,000 = $65,000
That means The Corner Table’s total prime cost for the month was $65,000. While this number is useful on its own, it becomes far more powerful when viewed as a percentage of total sales.
Calculating the Prime Cost Percentage
The manager jumps into the POS reports and sees that The Corner Table brought in $110,000 in total sales for July. Now we have everything we need for the final step.
Here’s the formula we’ll use:
Prime Cost Percentage = (Total Prime Cost / Total Sales) x 100
Let’s plug in the numbers from our example:
($65,000 / $110,000) x 100 = 59.1%
After rounding, The Corner Table’s prime cost for July is 59%. This one metric gives you an immediate, crystal-clear snapshot of your operational health. It means that for every dollar that came in the door, 59 cents went right back out to pay for products and people.
What Does a 59% Prime Cost Actually Mean?
A prime cost of 59% is a really solid number for a casual dining restaurant. It lands squarely in that sweet spot that successful operators are always aiming for.
This context is everything. Knowing their 59% is in line with high-performing restaurants tells the team at The Corner Table that their cost controls are working. It’s a sign that their menu pricing is on point, their scheduling is efficient, and their inventory management is dialed in.
This percentage isn’t just a number on a spreadsheet. It’s a validation of all their hard work and a key signal of sustainable profitability. Understanding this figure is the first step toward accurately forecasting your bottom line, which you can dive into with our restaurant profit margin calculator.
Actionable Ways to Get Your Prime Cost Under Control
Calculating your prime cost is the first step. Managing it is where real profitability happens. Prime cost isn’t a static number: it’s a metric you can influence every shift through smarter decisions around food and labor.
Lowering prime cost isn’t about cutting quality or hospitality. It’s about running a more efficient operation by focusing on the two biggest levers you control: COGS and labor.
Optimize Your Menu
Cost out every recipe and identify which items drive profit and which quietly drain it. Use menu engineering to highlight high-margin dishes, adjust underperforming favorites, and reduce waste through smart ingredient cross-utilization.
Tighten Inventory and Purchasing
Strong supplier relationships, consistent inventory counts, strict portion control, and disciplined FIFO practices help keep food costs from creeping up and protect your margins.
Schedule Labor With Intention
Align staffing with sales patterns using historical data and scheduling tools. Cross-training your team adds flexibility, reduces overtime, and prevents overstaffing without hurting service.
When tracked consistently, prime cost becomes more than a calculation; it becomes a powerful management tool for sustainable profitability.
Still Have Questions About Prime Cost?
Here are a few of the most common questions. Think of this as your quick-reference guide for mastering this essential metric.
How often should I calculate my restaurant’s prime cost?
While a monthly calculation is a decent starting point, the operators who are really on top of their game track prime cost weekly.
This gives you a massive advantage. A weekly check-in lets you spot a problem, like a sudden jump in produce prices or creeping overtime hours, and fix it before it can do serious damage to your bottom line.
Modern POS, inventory, and payroll systems can automate most of this, so it’s a completely manageable practice.
What is a good prime cost percentage for a restaurant?
This is the million-dollar question. The honest answer is that it depends on your concept. Still, there’s a widely accepted benchmark: according to Restaurant365, a healthy prime cost usually falls between 55% and 65% of total sales.
Here’s a rough breakdown to help you find your target:
- Quick-Service Restaurants: These spots should aim for 55% to 60%. Simpler menus and leaner labor models keep this number tight.
- Full-Service: Hitting 60% to 65% is a strong, healthy goal.
- Fine Dining: With higher-end ingredients and more intensive service, this model can sometimes push up to 65%.
The golden rule for most independent restaurants is to keep your prime cost at or below 60%. If you see your number creeping above 65%, that’s a major red flag. It means your two biggest expenses are squeezing the life out of your profitability.
Can I lower my prime cost without sacrificing quality?
Absolutely. In fact, that should always be the goal. Lowering your prime cost is about improving efficiency, not cutting corners. It’s about being smarter, not cheaper. Your guests should never notice a thing.
On the COGS side, you can make a real dent through precise portion control, regular inventory audits to catch waste early, and engineering your menu to feature your most profitable items.
For labor, it’s all about smarter scheduling. Use your sales data to build forecasts that prevent overstaffing on a slow Tuesday. Cross-training your team also builds a more flexible, efficient crew that can adapt when things get busy or a call-out happens. These are operational improvements, not compromises.
What are the most common mistakes when calculating prime cost?
The single biggest mistake is failing to include all the associated costs. This gives you a dangerously misleading number that looks better than it actually is.
For labor, operators often forget to add the “extras,” employer-paid payroll taxes, workers’ compensation insurance, and health benefits.
For COGS, inaccurate inventory counts are a classic culprit. Another common mistake is not properly accounting for comped meals, staff meals, or spilled drinks. The best way to avoid these manual errors is to use integrated software for your payroll and inventory. It ensures your calculation is built on solid data, not guesswork.
Ready to stop guessing and start managing your restaurant with data-driven confidence? MAJC✨ is the community-driven platform built by operators, for operators. Get the tools, training, and expert guidance you need to control your prime cost, build a stronger team, and run a smarter, more profitable business. Join the MAJC community today and turn your insights into action.