
Running a restaurant takes passion, but passion alone doesn’t keep the lights on. Long-term success comes from mastering the numbers. Industry ratios for restaurants, like Prime Cost and Contribution Margin, act as your operation’s vital signs. They show you what’s really happening beneath the surface and help you replace gut feelings with confident, data-driven decisions.
Why Your Restaurant’s Health Is a Numbers Game
For many operators, ratios and percentages feel intimidating, but they don’t have to be. Think of them as tools, not accounting homework. Just like a thermometer tells you when food is safe, these metrics tell you whether your business is healthy.
Understanding core industry ratios for restaurants helps you answer the questions that truly matter:
-
Are your menu prices actually profitable?
-
Is labor scheduled efficiently or quietly eroding margins?
-
Are you maximizing revenue during peak service?
Without these numbers, you’re guessing.
In this guide, we’ll focus on the industry ratios for restaurants that matter most, including food cost, labor cost, and prime cost, and how they connect directly to profitability through contribution margin. The goal is simple: give you clarity, control, and the confidence to make decisions that protect and grow your bottom line.
To get started, here’s a quick overview of the essential ratios successful operators rely on every day.
Key Restaurant Ratios at a Glance
This table summarizes the critical financial ratios, their ideal benchmarks, and what they measure in your restaurant’s performance. Think of it as your cheat sheet for financial health.
| Ratio | What It Measures | Ideal Benchmark |
|---|---|---|
| Prime Cost | The total cost of goods sold and labor, your two biggest expenses. | 55%–65% of total sales (varies by concept) |
| Food Cost % | The percentage of revenue spent on food ingredients. | 28% – 35% |
| Labor Cost % | The percentage of revenue spent on all payroll, taxes, and benefits. | 25%–35% (depending on concept and market) |
| Contribution Margin | The profit made on an individual menu item after its ingredient costs. | Varies by item; higher is better |
| EBITDA % | Profitability before interest, taxes, depreciation, and amortization. | 8%–15% for healthy operations |
| Table Turnover | How many times a table is occupied by a new party during a service period. | 1.5 – 3 per meal period, depending on segment |
| Inventory Turnover | How many times inventory is sold and replaced during a period. | 4 – 8 times per month (food inventory) |
The Big Three: Food Cost, Labor Cost, and Prime Cost
If you want to get a real handle on your restaurant’s financial health, you need to become obsessed with the three biggest, most controllable costs on your P&L. These are the numbers that successful operators live and die by: food cost, labor cost, and the one metric to rule them all, prime cost.
Nailing these three is the first and most critical step toward building a business that actually makes money. Let’s break each one down so you can calculate them with confidence.
Decoding Your Cost of Goods Sold
Your Cost of Goods Sold (CoGS), which most of us just call food cost percentage, is simple: it measures how much you spend on ingredients to produce your food and beverage sales. This is one of the most vital industry ratios for restaurants because it tells you exactly how profitable your menu is.
The formula is pretty straightforward:
Food Cost Percentage = (Beginning Inventory + Purchases – Ending Inventory) / Food Sales
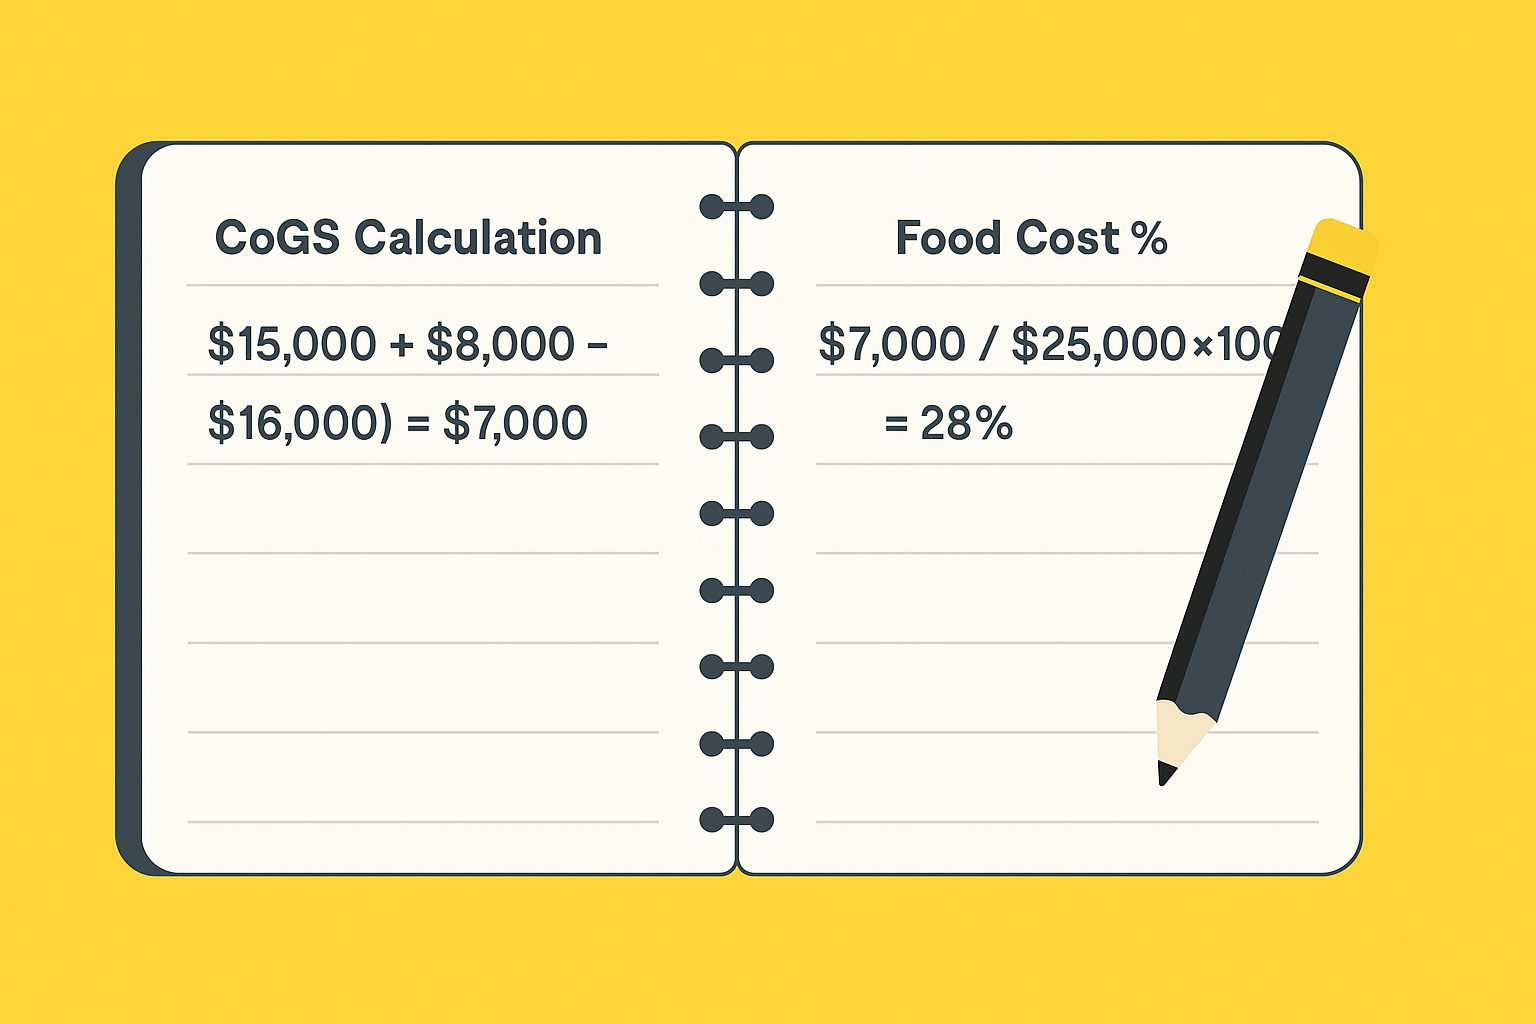
Let’s walk through an example. Say you started the month with $15,000 in food inventory. You bought another $8,000 in ingredients throughout the month, and when you took inventory at the end, you had $16,000 left. During that same time, your food sales hit $25,000.
- CoGS Calculation: ($15,000 + $8,000 – $16,000) = $7,000
- Food Cost %: ($7,000 / $25,000) x 100 = 28%
A 28% food cost is a great number. It falls right in the sweet spot of the typical industry benchmark, which is 28% to 35%, according to Restaurant365. If your number starts creeping above that range, it’s a red flag signaling potential issues with waste, sloppy portioning, or rising supplier prices.
Calculating Your True Labor Cost
Labor isn’t just about hourly wages. Your true labor cost percentage has to include every single dollar you spend on your people. This gives you a complete picture of your second-largest expense.
To get an accurate number, you need to add up all the associated costs:
- Hourly wages and manager salaries
- Payroll taxes (like Social Security and Medicare)
- Employee benefits (health insurance, PTO, etc.)
- Workers’ compensation insurance
Once you have that total labor cost, you can calculate its percentage against your total sales. For a deeper dive on this metric, check out our guide on understanding labor cost percentage in our detailed article. For most full-service restaurants, keeping this figure between 25% and 30% of revenue is a solid goal.
Bringing It All Together with Prime Cost
Now for the most powerful metric in your entire toolkit: Prime Cost. This ratio is the big one because it combines your two largest controllable expenses, CoGS and total labor, to show you the total cost of creating and serving your product.
The formula couldn’t be simpler:
Prime Cost = Cost of Goods Sold (CoGS) + Total Labor Cost
To turn it into a percentage you can actually use, just divide it by your total sales. Let’s stick with our earlier numbers. Our CoGS was $7,000. Let’s say our total labor cost for the same period was $9,000, and our total sales were $30,000.
- Calculate Prime Cost: $7,000 (CoGS) + $9,000 (Labor) = $16,000
- Calculate Prime Cost Percentage: ($16,000 / $30,000) x 100 = 53.3%
That 53.3% is an excellent result. The gold standard for a healthy prime cost is 60% or less, according to industry guidance from Toast.
If your prime cost is creeping above that mark, it’s a clear warning that either your food or labor expenses (or both) are running too hot for your current sales. Tracking this number weekly gives you the power to react fast, make adjustments, and protect your profits before a small leak turns into a big problem.
Measuring Profitability and Performance
Once you’ve got a firm handle on your prime cost, you can shift from just controlling expenses to actually measuring what you earn. This is where profitability ratios come in. Think of them as the financial report card for your restaurant, showing you the real results of all your hard work.
It’s like this: managing prime cost is making sure you have the best ingredients and a sharp kitchen team. Measuring profitability is tasting the final dish to see if it’s a winner.
Gross Profit Margin
The first metric to get your head around is Gross Profit Margin. This ratio tells you how profitable your menu is before you even think about overhead like rent or utilities. It’s the pure profit you make on what you sell, looking only at the cost of the ingredients (your CoGS).
The formula is simple but incredibly powerful:
Gross Profit Margin = (Total Revenue – CoGS) / Total Revenue x 100
Let’s say your restaurant pulled in $50,000 in sales last month and your CoGS was $15,000. Your gross profit would be $35,000, which makes your Gross Profit Margin a healthy 70%. A strong number here is a great sign that your menu is priced correctly against what it costs to make.
Net Profit Margin
While Gross Profit is a big deal, Net Profit Margin is the ultimate bottom line. This is the cash you actually get to keep after every single expense gets paid: rent, utilities, marketing, salaries, you name it. It’s the truest measure of whether your restaurant is a financial success.
This is the number that tells you how efficiently your business is turning revenue into actual, take-home profit.
For full-service restaurants, a typical net profit margin hovers between 2% and 6%. Fast-casual spots often do better, hitting 6% to 9%, mostly because their labor costs are lower and their operations are more streamlined.
Running your own numbers can feel like a chore, but some great tools out there make it easier. To get a clear picture of where you stand, check out our restaurant profit margin calculator. It’s a simple way to track your performance.
Understanding EBITDA
You’ll often hear accountants and investors throw around the term EBITDA. It stands for Earnings Before Interest, Taxes, Depreciation, and Amortization. It sounds complicated, but the idea is actually pretty straightforward.
EBITDA gives you a clean look at your restaurant’s core operational profitability, stripping out the influence of accounting rules and financing decisions.
Here’s a quick breakdown of what it removes from the net profit equation:
- Interest: Payments on any loans you have.
- Taxes: Corporate or income taxes owed.
- Depreciation: The slow decline in value of your physical assets, like ovens, tables, and chairs.
- Amortization: This is like depreciation, but for intangible assets, such as the initial cost of your liquor license.
By taking these items out of the picture, EBITDA lets you compare your day-to-day operational performance directly against other restaurants, no matter how much debt they have or what their tax situation looks like. It’s a fantastic tool for understanding the pure earning power of your operation.
Operational Ratios That Drive Efficiency
True profitability isn’t just about nailing your prime cost. It comes from running a tight, well-oiled operation. This is where operational ratios come in. They measure how effectively you’re using your core assets: your physical space, your team, and the inventory sitting on your shelves.
Think of these metrics as a performance review for your restaurant itself. They show you exactly how well your systems and your team are working together to turn those assets into revenue. Mastering these numbers is how you maximize your profit potential, especially when you’re slammed.
Maximizing Your Physical Space with Sales per Square Foot
Your rent or mortgage is almost always one of your biggest fixed costs. The Sales per Square Foot ratio tells you if you’re getting your money’s worth out of every inch of that space. It’s a powerful metric for evaluating everything from your dining room layout to your kitchen’s workflow.
The formula is straightforward:
Sales per Square Foot = Total Sales / Total Square Footage
Let’s say your restaurant brought in $800,000 in annual sales and you’re working with 2,000 square feet. Your sales per square foot would be $400. This number can swing wildly depending on your concept. A bustling city bistro might push past $1,000 per square foot, while a roomy suburban family spot could be perfectly healthy at $250. The key is to compare your number to similar restaurants to get a real benchmark for success.
Improving Service Speed with Table Turnover Rate
In this business, time is money, and your tables are your most valuable real estate. The Table Turnover Rate measures how many parties you seat at a single table during a specific period, like a Friday night dinner rush. A higher turnover rate means more guests served and, you guessed it, more revenue.
Here’s the math:
Table Turnover Rate = Number of Parties Seated / Number of Tables
If you served 150 parties during dinner service and you have 50 tables, your turnover rate is three. That means, on average, each one of your tables was used by three different groups. To nudge this number up, you can focus on streamlining service, using a reservation system to manage guest flow, and training your team to clear and reset tables with lightning speed.
Managing Your Stock with Inventory Turnover
The Inventory Turnover ratio shows how often you sell through your entire stock of food and booze in a given period. A healthy turnover rate is a sign of smart purchasing and minimal waste.
First, you’ll need your Cost of Goods Sold (CoGS) for the period you’re measuring.
Inventory Turnover = Cost of Goods Sold / Average Inventory
A low turnover rate, say, less than four times a month, could mean you’re overstocking, which ties up cash and raises the risk of spoilage. On the flip side, a really high rate might mean you’re constantly at risk of 86-ing key items. There are a few different ways to get a handle on your stock levels, and you can dive deeper with our guide to the inventory days on hand formula. Striking that perfect balance is crucial for both your cash flow and keeping your guests happy.
Tracking these operational industry ratios for restaurants gives you the hard data you need to make smart adjustments, from tweaking your floor plan to fine-tuning your service, all in the pursuit of a stronger, more profitable business.
Putting Your Restaurant Ratios into Action
A ratio is just a number on a spreadsheet until you turn it into a concrete plan that boosts your bottom line.
This section is your playbook for turning those financial insights into tangible, profitable results.
Tackling a High Food Cost Percentage
If your food cost percentage is creeping up, it’s a red flag that profit is slipping through the cracks. This is one of the most common battles every operator fights, but it’s also one of the most controllable with the right game plan. Don’t just accept it as the cost of doing business; attack the problem from every angle.
Here are a few targeted moves you can make right away:
- Drill Down with Menu Engineering: Pull up your sales data and analyze every single item. Pinpoint your stars (high profit, high popularity) and your dogs (low profit, low popularity). Your job is to promote the stars relentlessly and either re-price or 86 the dogs for good.
- Strengthen Supplier Negotiations: Don’t get complacent with your vendors. Get regular quotes from different suppliers to make sure you’re getting the best price on key ingredients without sacrificing quality. Strong relationships can also open the door to better deals and more flexible payment terms.
- Enforce Strict Portion Control: This is nonnegotiable. Every dish needs to be made with portioning tools like scales and standardized scoops. A little extra cheese here and there on a few dozen plates adds up to serious waste and lost profit by the end of the month.
Getting a Handle on Rising Labor Costs
When you see your labor cost percentage climbing, it’s time to get surgical with your schedule.
Your schedule is the best defense against a bloated payroll. Focus on matching your staffing levels directly to your sales forecasts. If Tuesday afternoons are dead, your schedule better reflect that reality.
The goal is to have enough staff to deliver excellent service without having people standing around during lulls. This balance is critical for protecting both your guest experience and your profit margin.
Another powerful move is staff cross-training. When your team is versatile, you gain incredible flexibility. A host who can also run food or a line cook who can jump on the fry station makes it easier to cover call-outs and manage unexpected rushes without overstaffing. It also creates a more engaged, valuable team. To make this stick, you need to build these practices into your daily operations. You can learn more about creating that kind of consistency by exploring these restaurant standard operating procedures examples.
Using Contribution Margin to Boost Profits
Finally, let’s talk about one of the most powerful and often overlooked tools for menu analysis: Contribution Margin. While food cost percentage tells you what an item costs relative to its price, contribution margin tells you the exact dollar amount each sale adds to your profit.
The formula is dead simple:
Contribution Margin = Menu Price – Cost of Ingredients
Looking at your menu this way helps you see which items are your true cash cows. A steak might have a higher food cost percentage than a pasta dish, but if it contributes $18 to your gross profit with every sale versus the pasta’s $8, it’s a far more valuable plate.
Focus on selling more of your high-contribution-margin items. Use menu design, server suggestions, and daily specials to guide guests toward the dishes that make you the most money. This simple shift in focus can have a massive impact on your overall profitability without forcing you to overhaul your entire menu. By combining these actionable strategies, you can turn your understanding of industry ratios for restaurants into a powerful engine for growth.
Your Questions on Restaurant Ratios Answered
Think of this as a quick Q&A session to clear up any lingering confusion. We will tackle the most common questions about industry ratios for restaurants so you can apply these concepts with confidence and make smarter decisions for your business.
What is the most important ratio for a restaurant?
While you need to watch a handful of metrics, most seasoned operators will tell you that Prime Cost is the single most critical number. Why? Because it wraps your two largest controllable expenses, Cost of Goods Sold and total labor, into one powerful figure.
This combination gives you the clearest, most immediate snapshot of your operational efficiency. As we mentioned before, a healthy Prime Cost, ideally kept under 60% of total sales, is the strongest signal of your restaurant’s day-to-day financial health. Tracking it weekly lets you react fast to issues with menu pricing, staffing, or purchasing before they can do serious damage to your monthly profits.
How often should I calculate my restaurant ratios?
The right frequency really depends on the ratio you’re looking at. Some metrics are sprinters, changing day-to-day, while others are more like marathon runners, revealing trends over the long haul. The key isn’t a rigid rule, but consistency.
Here’s a practical schedule to follow:
- Weekly: Calculate your most volatile and controllable costs. This means your food cost percentage, labor cost percentage, and, of course, your Prime Cost. Checking these every week gives you the power to spot a problem and fix it fast.
- Monthly: This is the perfect time to review your bigger-picture financial ratios. As you close out your books and review your profit and loss (P&L) statement, calculate your net profit margin and EBITDA.
- Monthly or Quarterly: Long-term efficiency ratios don’t need constant watch. Analyze metrics like sales per square foot, inventory turnover, and table turnover every month or three to identify broader operational trends and opportunities for improvement.
My ratios are below industry benchmarks. What should I do first?
If your industry ratios for restaurants are below benchmark, don’t panic, diagnose. Start with Prime Cost, since it combines your two biggest levers: food and labor. That alone will tell you where the real problem lives.
From there, focus on one issue at a time. If food cost is high, review supplier pricing, portion control, and menu performance. If labor is the issue, look closely at scheduling during slow periods. Avoid trying to fix everything at once.
Make one targeted change, track the relevant ratio for a few weeks, and adjust as needed. This focused, data-driven approach leads to far better results than sweeping changes, and builds sustainable improvement over time.
At MAJC✨, we provide restaurant operators with the tools, training, and community support needed to turn financial insights into real-world profits. From expert-led workshops on cost control to a resource library packed with templates for scheduling and inventory, we help you run a smarter, more sustainable business. Explore how MAJC can strengthen your operations today.